Limit the Number of Pages in a Report

Aim for one to seven pages per report.

The number of pages in your report can influence your audience's perception of the report before viewing it.

Less pages equal easier to read

The fewer pages in a report, the easier it is for your audience to remember content on each of the pages.

If your data story needs more than six or seven pages to tell in its entirety, create multiple reports that each has a few pages. Then, link the primary report to secondary reports, as needed, for additional details.

Less pages equals an organized report

For example, a report about sales and marketing can have pages about the marketing effort and its effect on sales. The primary report links to two secondary reports: one report with information for the sales audience and another report with information for the marketing team. You can use this same technique to link from a high-level report to target reports with detailed content.

Each page should stand on its own
Each page in a report should stand on its own.

Spreading data across multiple pages in a report - when that data should be kept together - can undercut data comprehension. Focus each page on communicating one point or answering a single question that advances your audience along in your data story.

Be aware that, as your audience members read through the report, their memory and interpretative skills can be overwhelmed. Do not require your audience to remember content from one page to the next. Help them understand what they are viewing by providing titles.
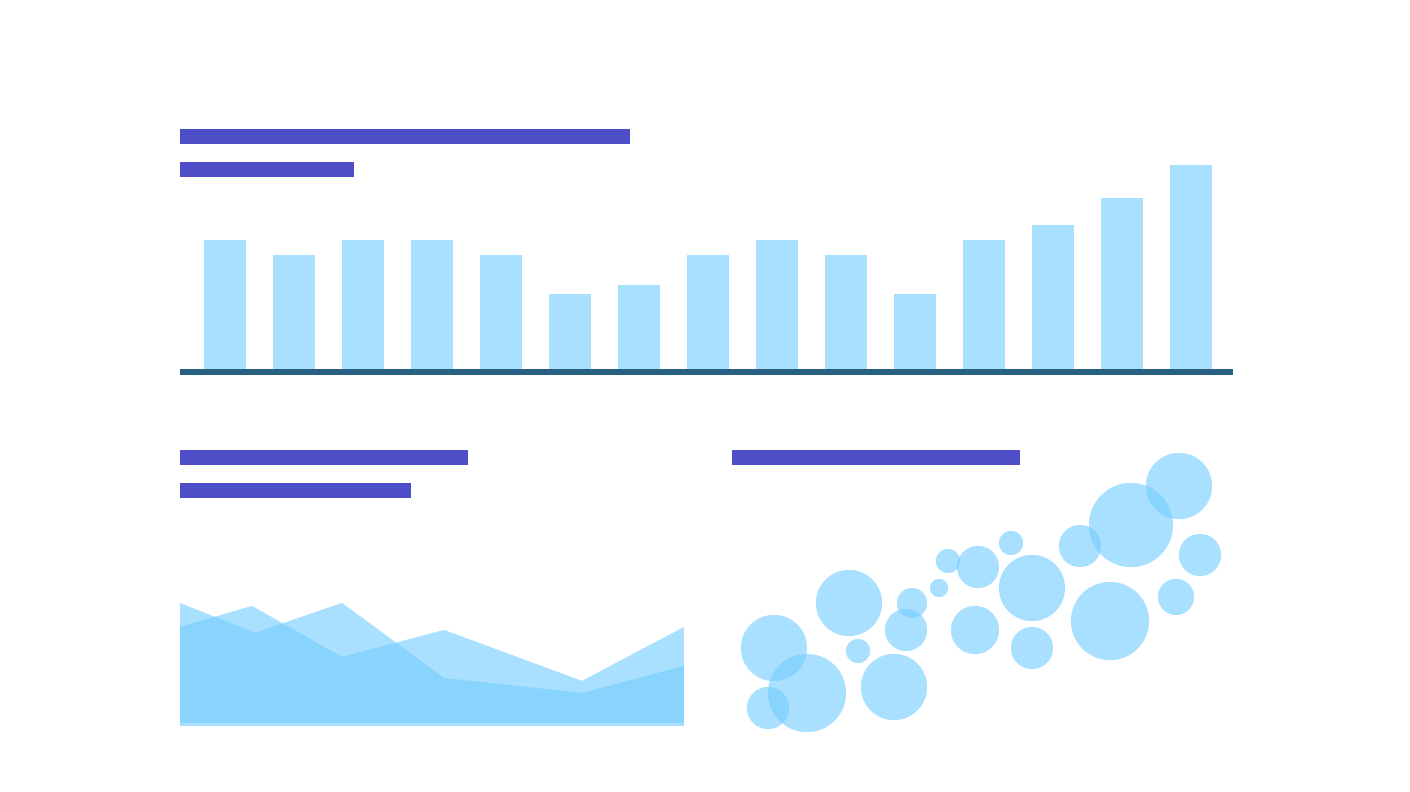
Titles establish page hierarchy
Titles aid comprehension and provide visual hierarchy.
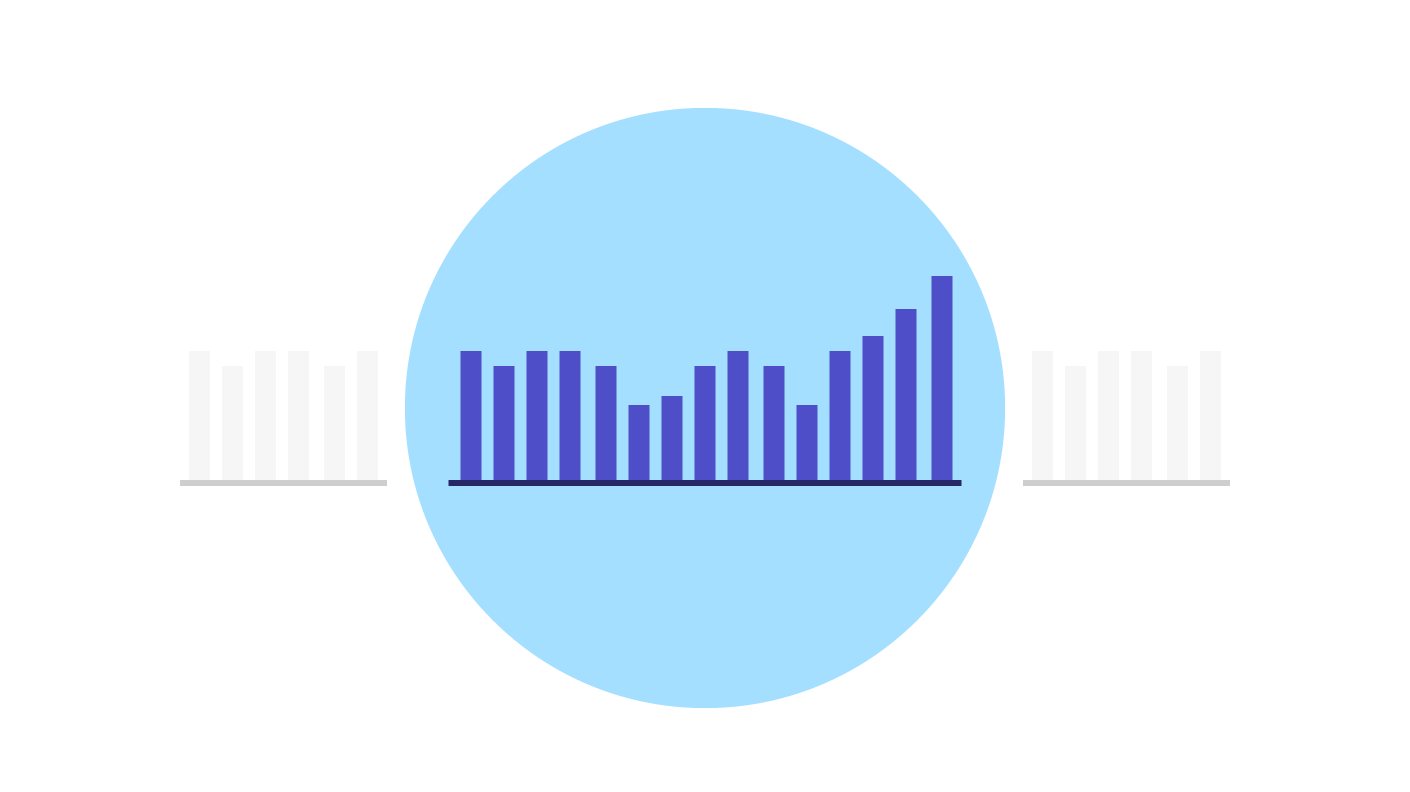
Each page should concentrate on a single idea.

Mobile in Mind

Reports with fewer pages are faster to download on mobile networks, and they open faster, too. Report linking can filter the data shown in the secondary report. The audience members download only the target reports applicable to them. This saves time and device storage.
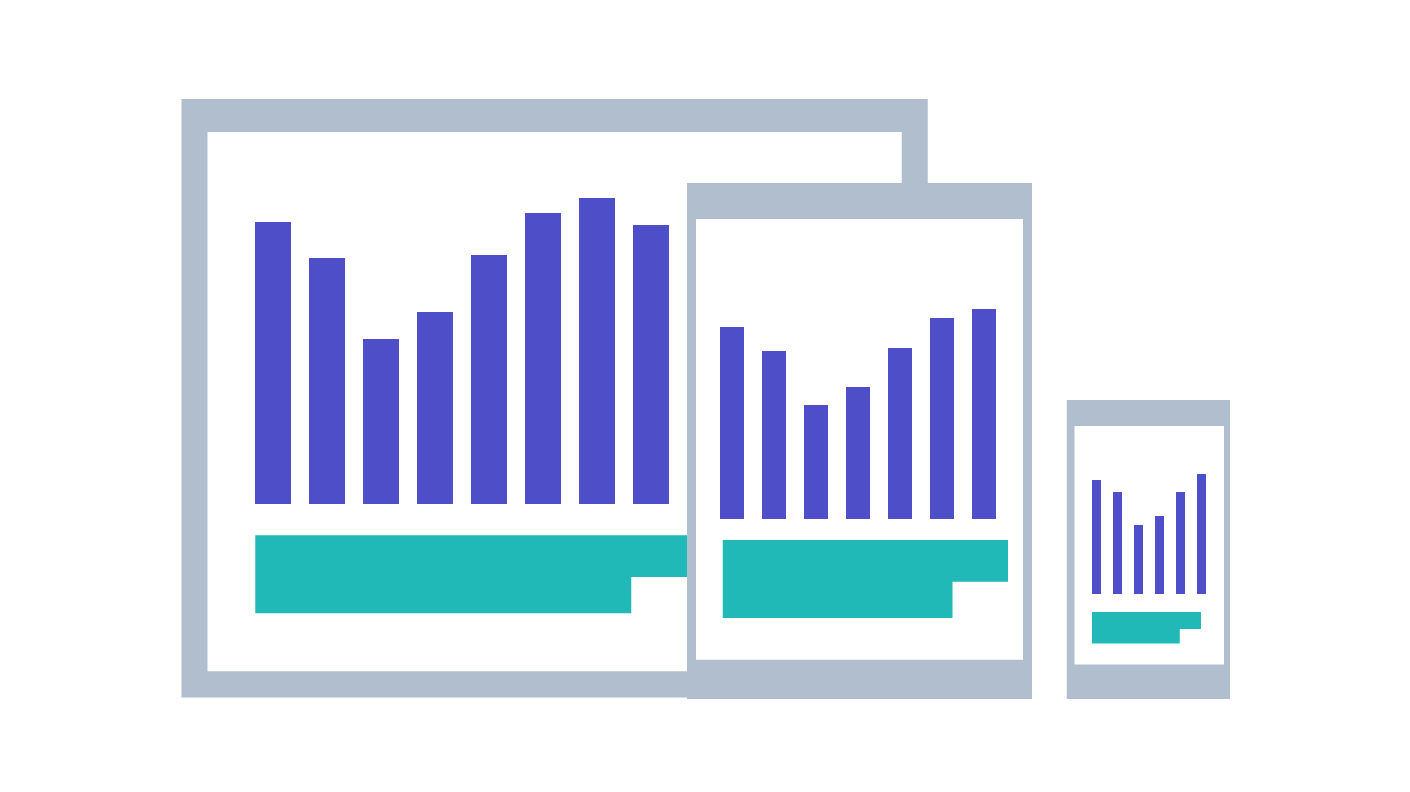
Smaller reports are easier to load on mobile

Limit the Number of Objects on a Page

Aim for two to six objects per page.

Limiting the number of objects on a page can improve your audience's ability to focus on your data, as well as improve your audience's comprehension of your data.

The more objects that are on a page, the less relevant they seem. By limiting the number of objects and increasing the white space around them, you enhance the visibility of your data.

Limit objects on each page

Typically, users do not want to see all possible report objects at one time. Instead, users prefer to see only the few report objects that support the specific and concrete questions they are investigating.

How do you choose which report objects to show?

Consider using a stacking container to handle multiple objects

One way to manage the density of a page is to use a stacking container. A stacking container has the following features:

Improve your audience's comprehension of your data.

The larger the graph or chart, the more time your audience spends studying it. Your audience will merely glance at relatively smaller graphs and charts.

When a graph or chart is meant for a specific task that requires much detail, make that graph or chart larger to enable your audience to easily study and comprehend the details and data.

Focal points help create hierarchy

Avoid the temptation to reduce the size of objects and pile several on a page. Doing so causes the objects and their data to be illegible.

Instead, carefully identify the objects that are important to compare with each other, and locate those objects on the same page. Relocate the remaining objects to another page or to another report.

Focal points also minimize distraction

Mobile in mind

Reducing the visual complexity of each page means it is more likely the content will fit on a tablet without the need to scroll. Limiting content to one screen eases interactions such as filtering between objects and visual comparison between objects on the page.

The report layout (not the data) is described in XML. The more report objects, the larger the XML. The larger XML, the more time it takes to open and render the layout of the report.