Embrace White Space in Your Report
What Is White Space?
White space refers to the areas in your report that do not contain content.
For example, the spaces between the visual elements in a report are considered white space, even if the background color is not white. White space is also referred to as negative space.

Why Use White Space?
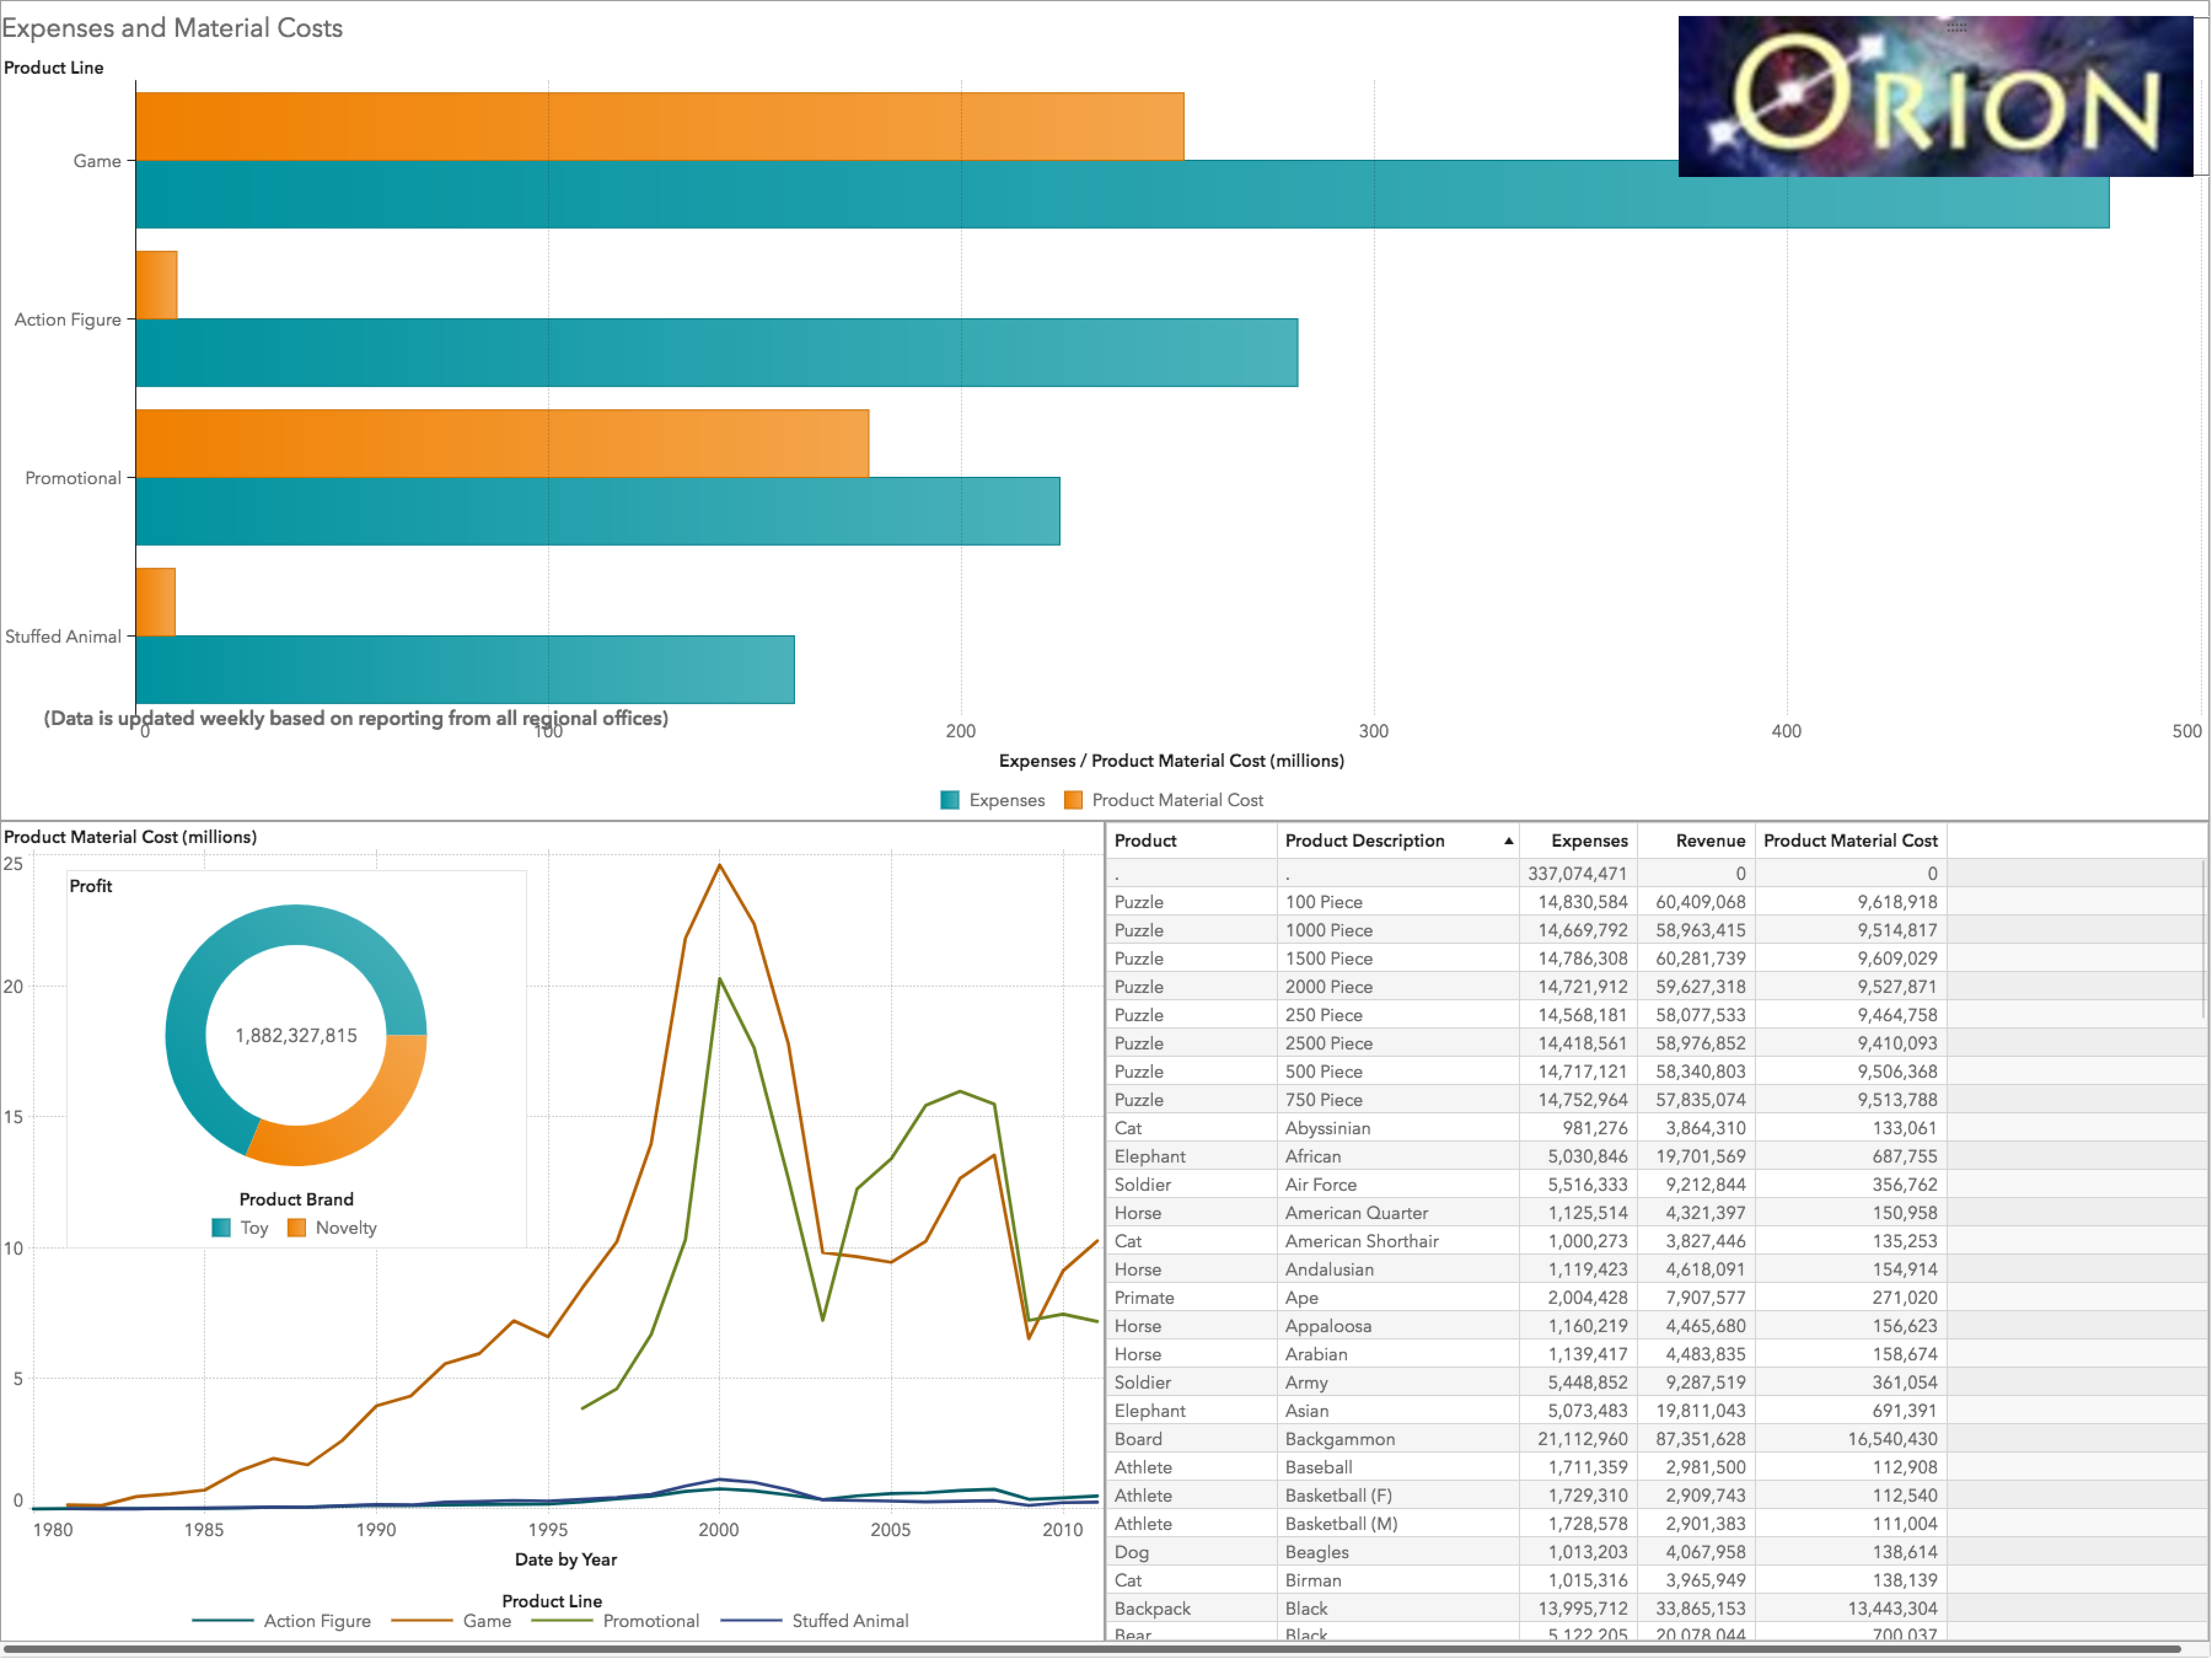
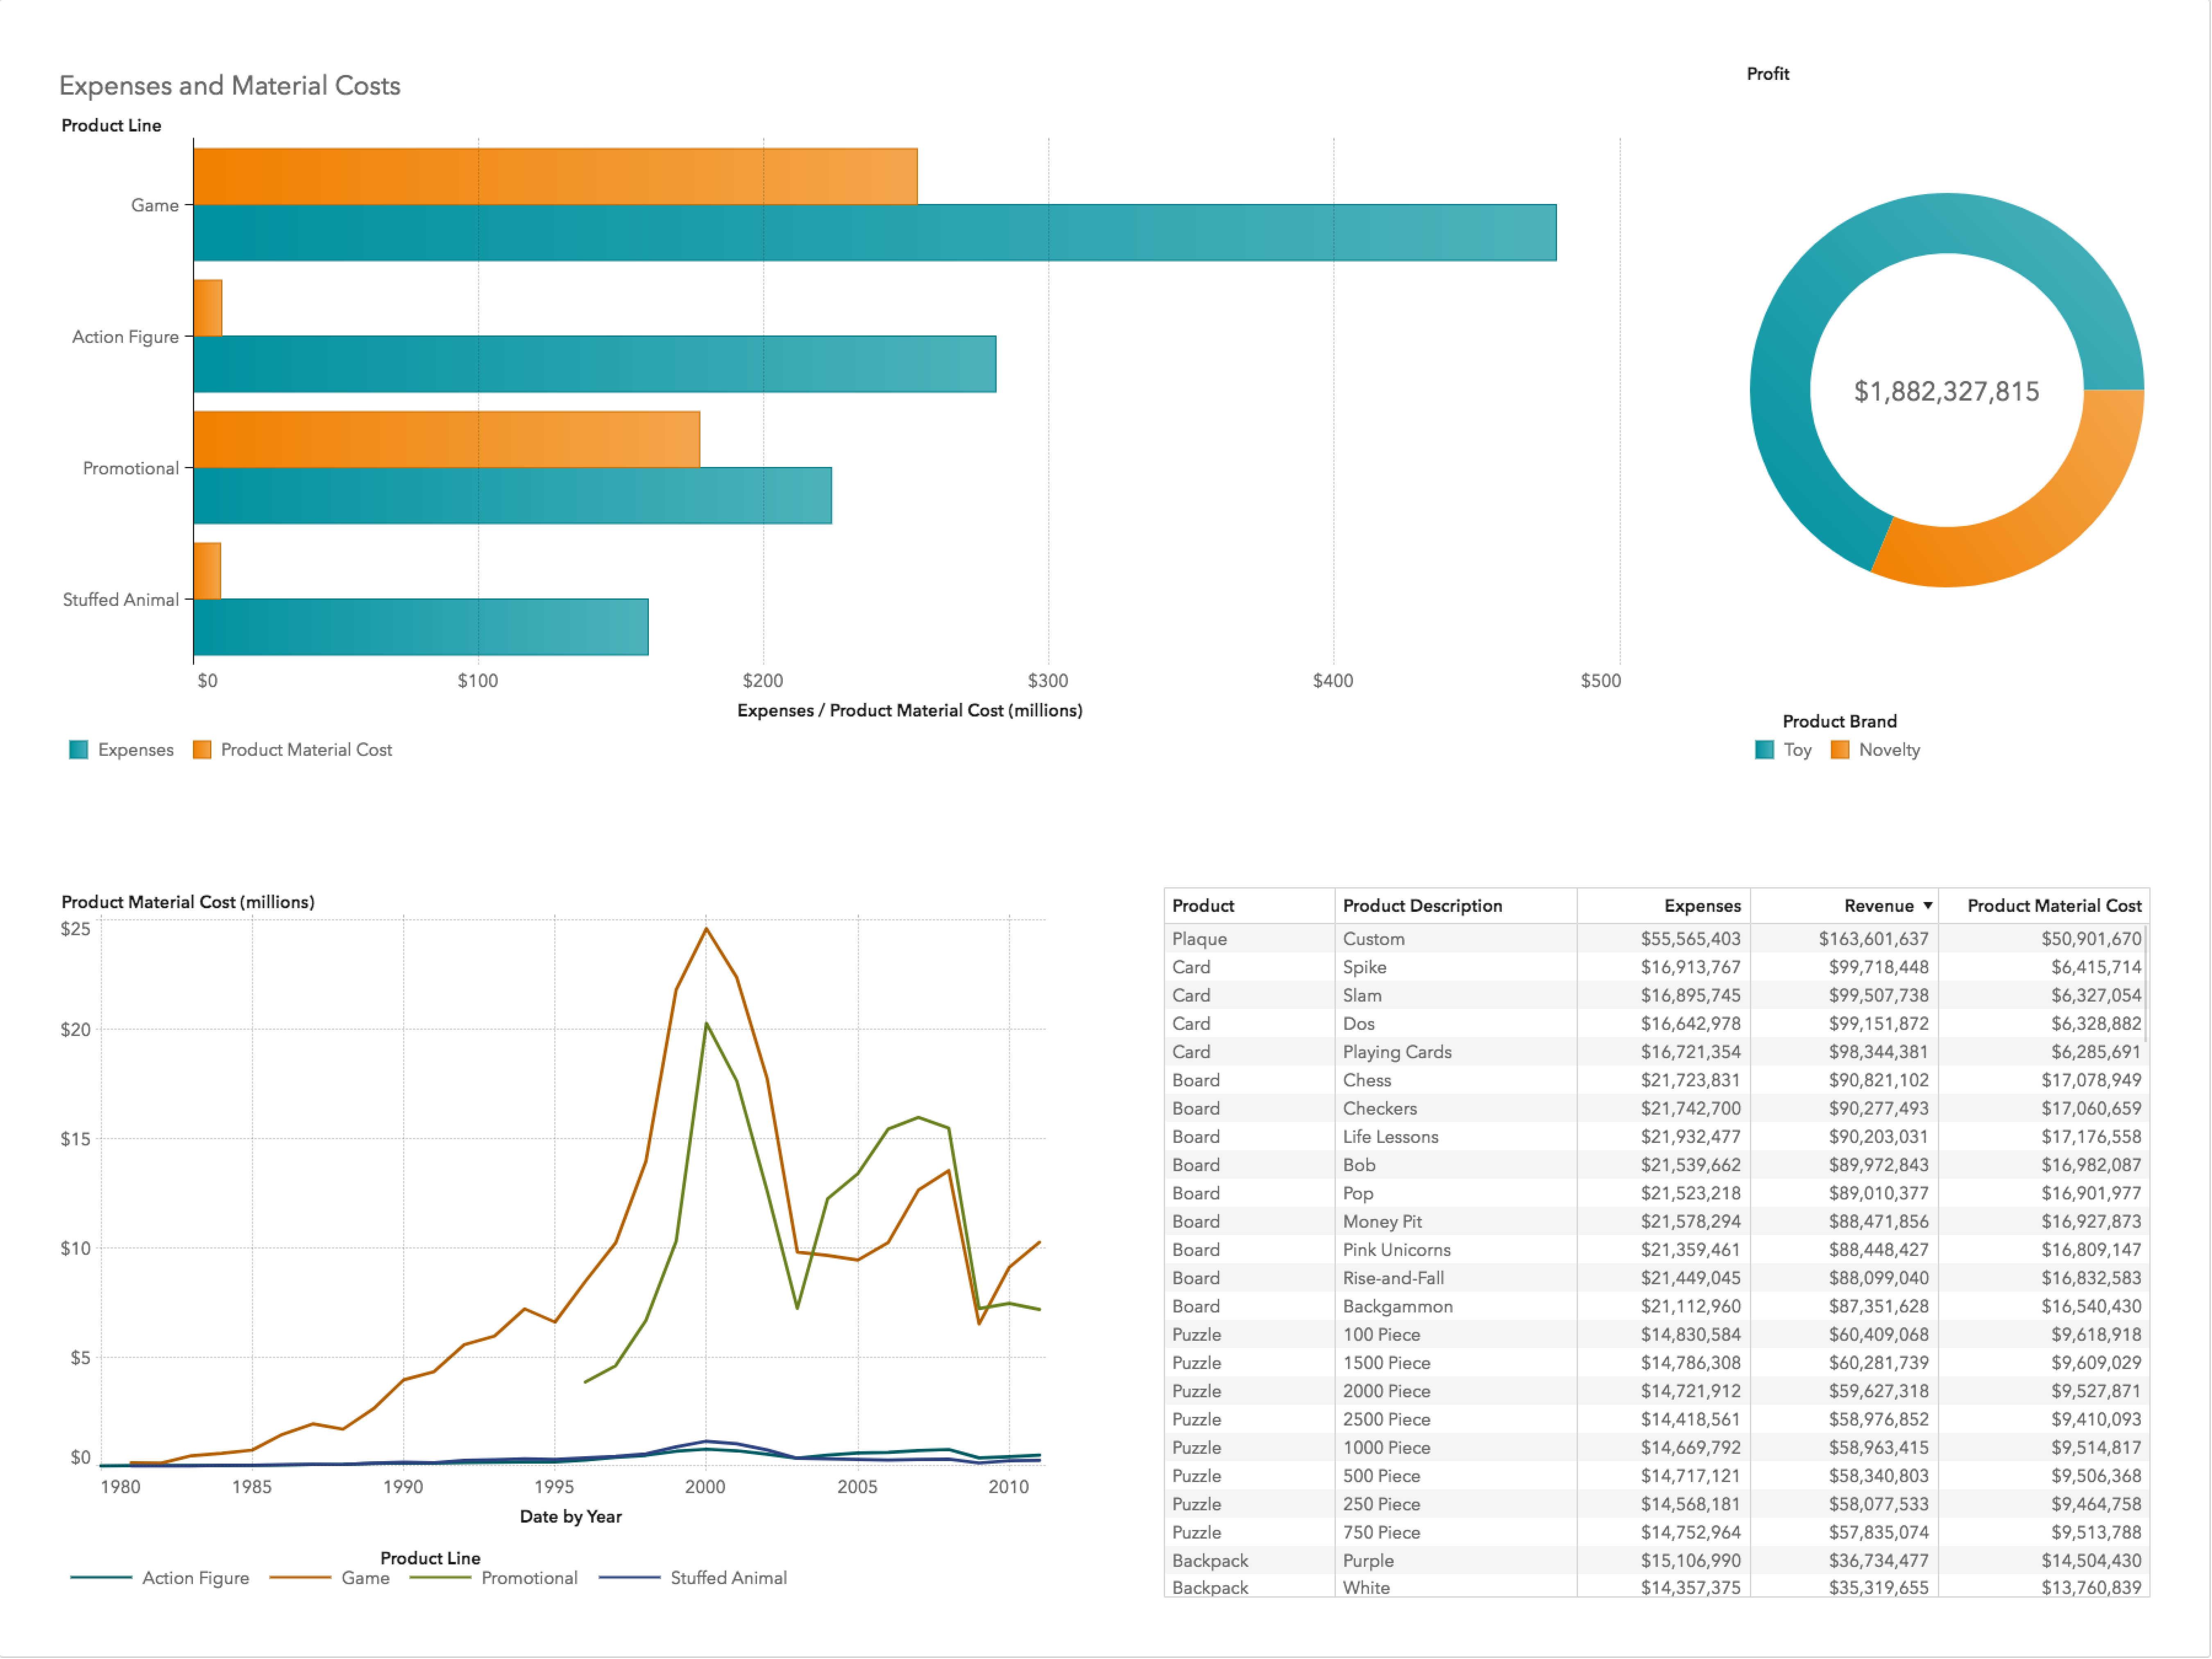
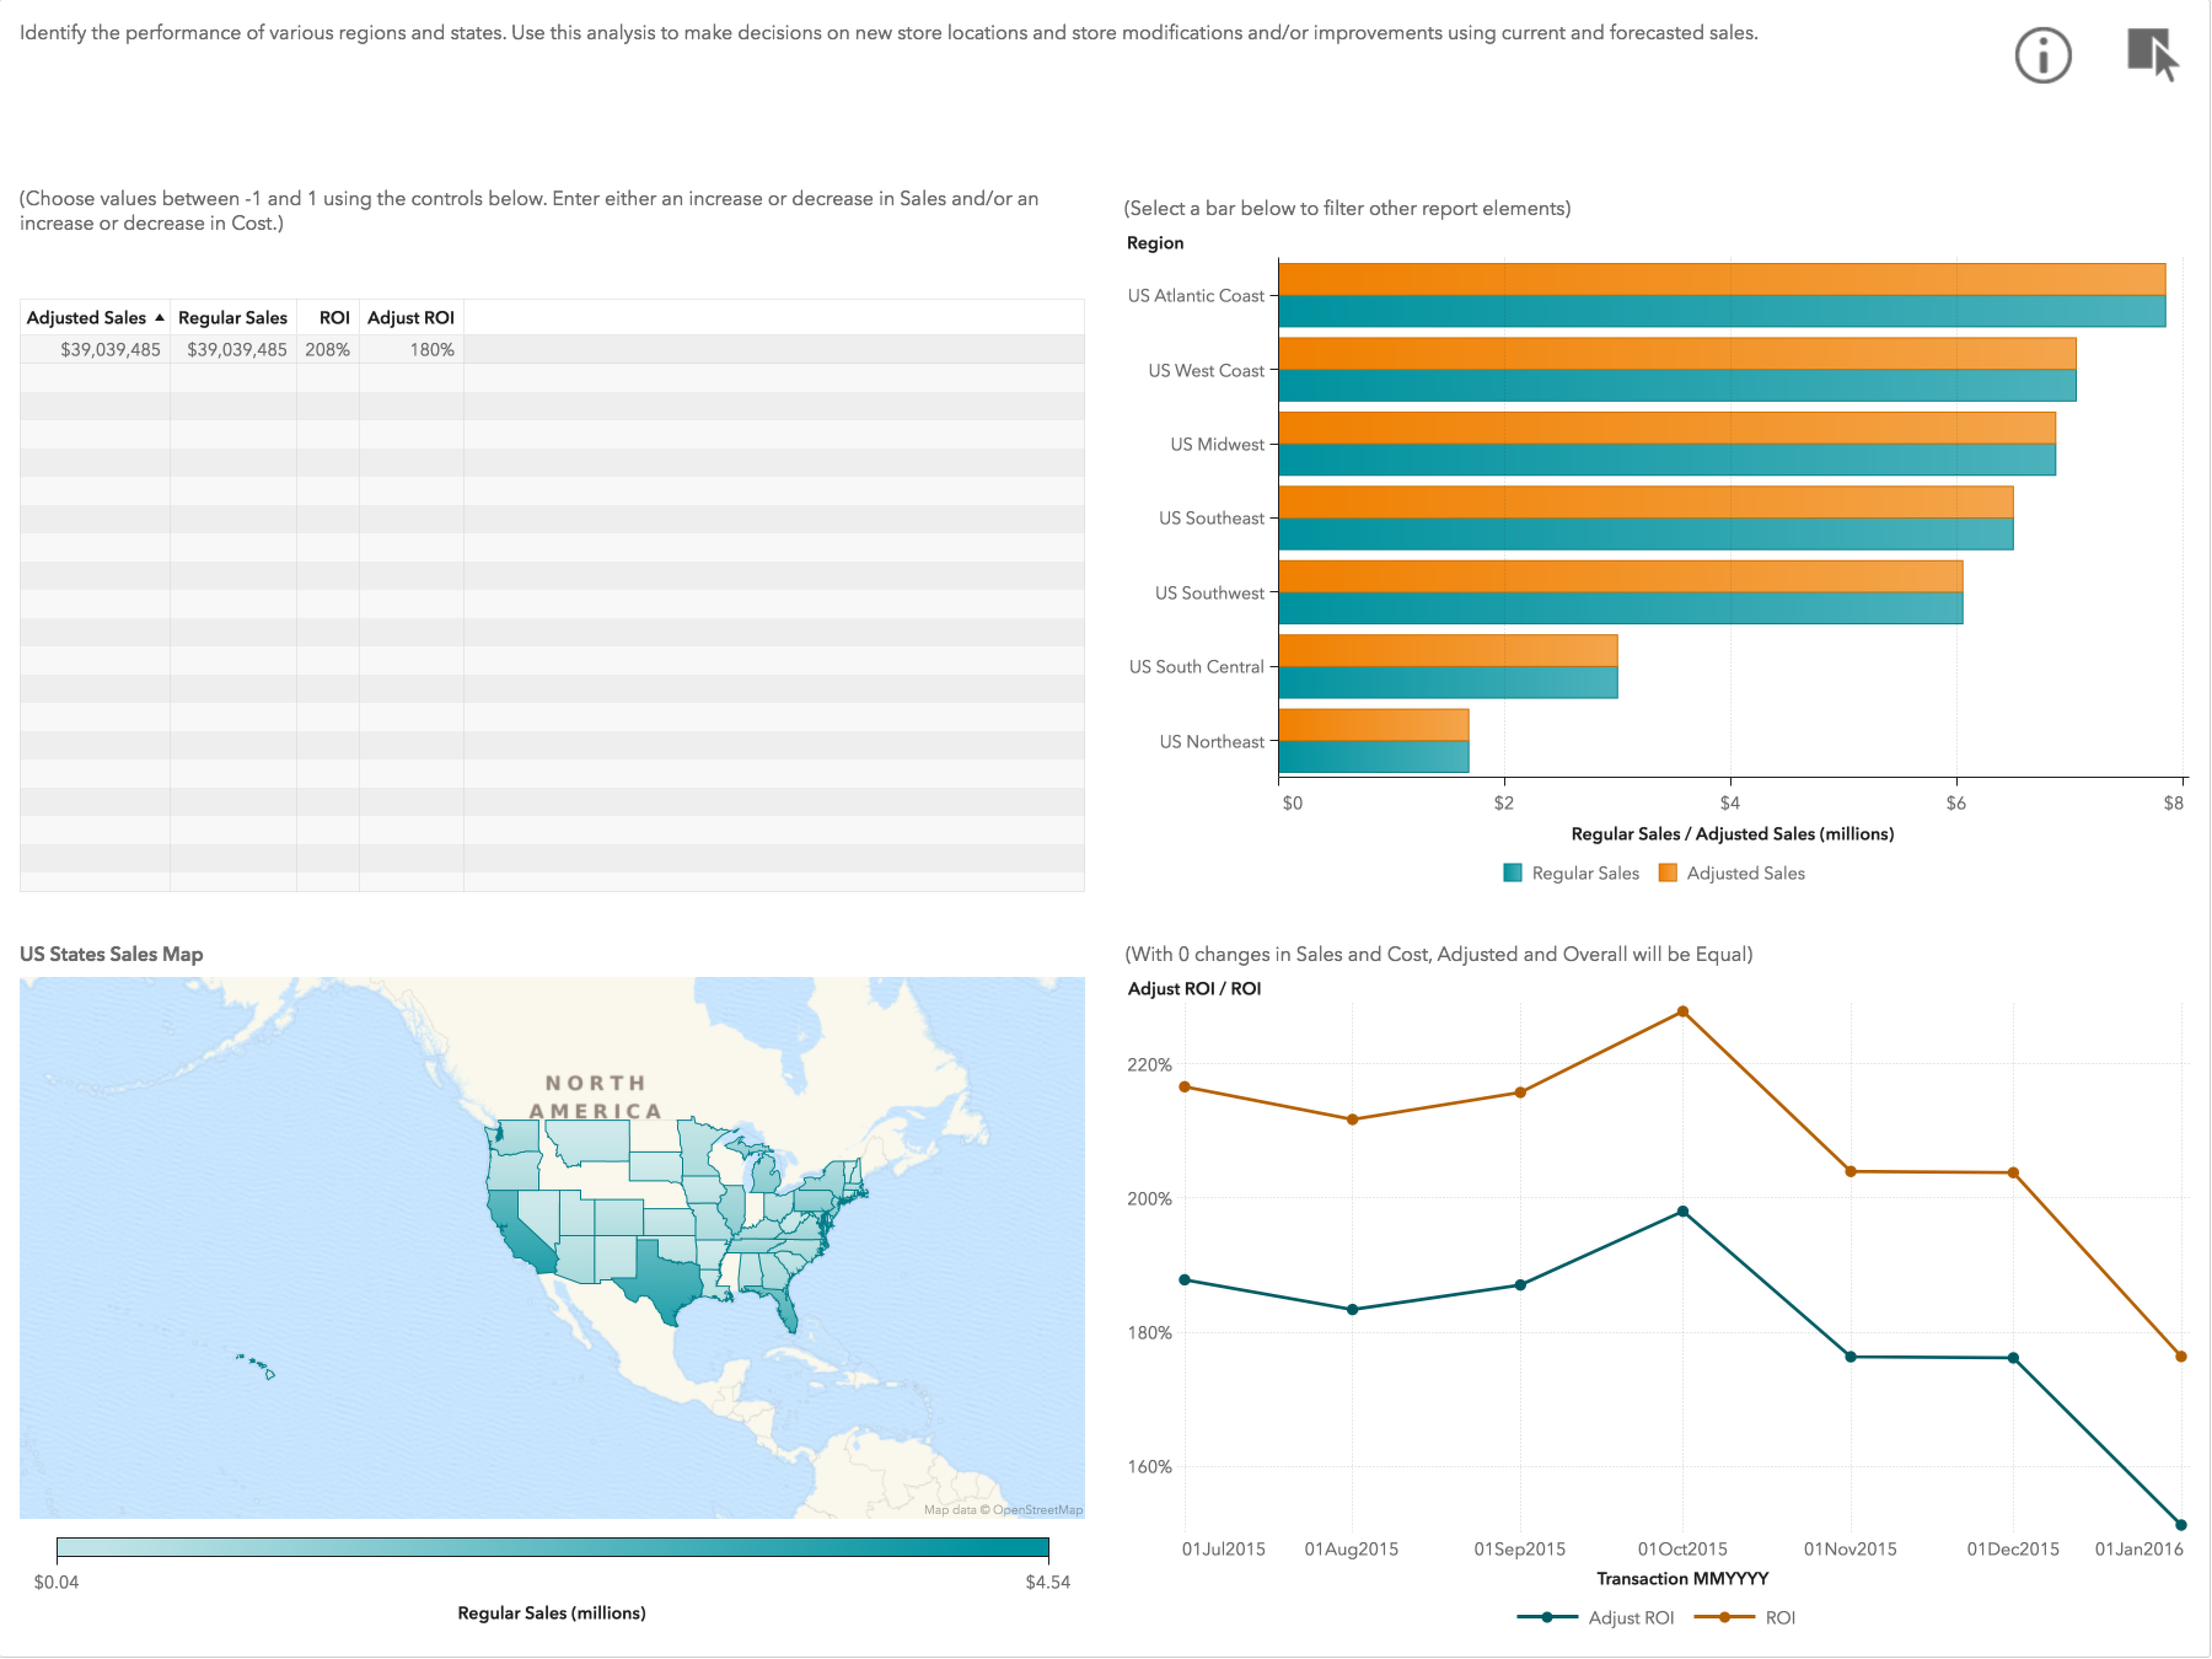
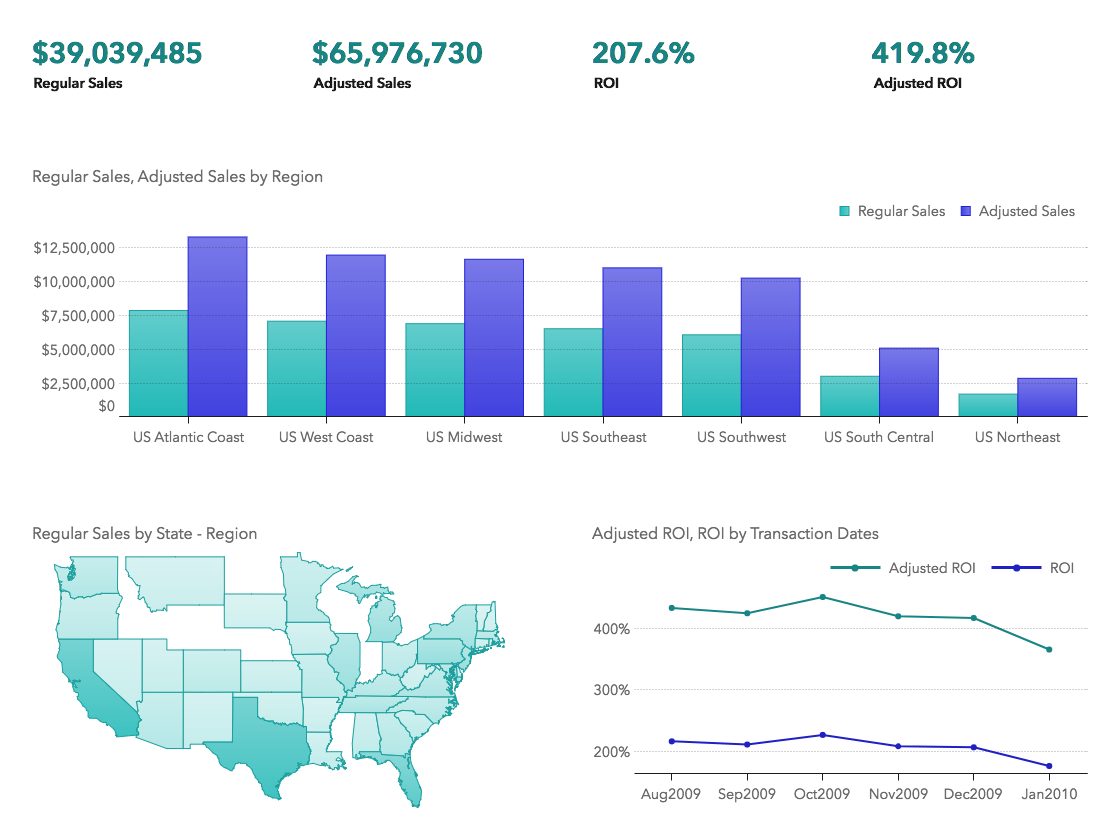
- White space establishes a visual framework that enables the viewer to easily understand the content and organization of the report.
- Closely spaced content requires additional time and effort from the viewer to parse.
- A report that is free of clutter and has ample white space is more visually appealing and elegant.


Many report designers attempt to fill every pixel of the page with content and decoration. Don't view empty space as wasted space. White space plays an essential role in your visual design.
White Space Provides Visual Organization
The white space in your report creates a visual grid that organizes your content. The alignment of visuals on the grid helps to connect and separate content. For example, report objects that are side by side in the same row are intuitively understood to be related.Avoid placing borders around your content. White space can separate your visual elements without creating clutter.


Margins and Padding
As a design principle, it is recommended that you include generous margins and padding around your pages and report objects. In SAS Visual Analytics 8.1 and later, the Padding option enables you to specify the padding around each report object. To achieve a balanced design, ensure that the padding is consistent for each element on a report page. By using precision layout, you can adjust your margins and padding. However, be aware that precision layouts do not adjust well to smaller screens and are often unusable on mobile devices.

Create a Focal Point
The focal point is the object that grabs the viewers' attention. It provides a starting point for viewers as they take in the content of the page.
To establish an object as the focal point, position it at either the top of the page or the left side (or the right side if your audience reads from right to left). The focal point object should be the largest object on the page, often filling more than 50% of the page width or height.


For each page in your report, if there is an object that drives interactions, then that object should be the focal point.
Avoid having multiple elements that compete for the viewers' focus. Omit any unneeded images from the report.
